"hurst exponent go brrrr" - are your assumptions about persistence reasonable?
traders often implicitly assume recent conditions will persist - without checking whether that's likely to be true.
you really need to understand the assumptions you are making, and whether they are reasonable.
here are some examples and a simple analytical approach...
...
"i want to find an asset with characteristics X
"so I'm going to look for stuff which showed these characteristics in the recent past - and I'll hope it carries on having them for a while."
sometimes this is reasonable. sometimes it is wishful thinking.
how do we tell?
...
here's an example of something we know is persistent - volatility.
"i want to find a low volatility stock - so I'm going to look for stocks which have been low vol this year"
is this reasonable, or wishful thinking? Let's see...
we look at Russell 1000 constituents since 1999.
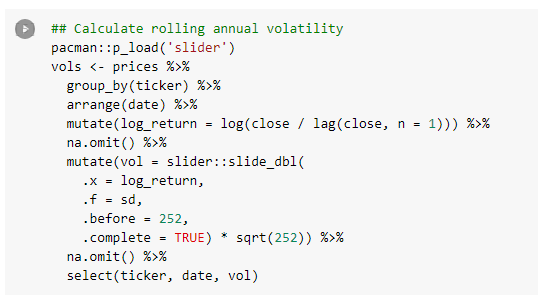
we estimate vol as the sd of close-to-close log returns * sqrt(252) for each stock, each year.
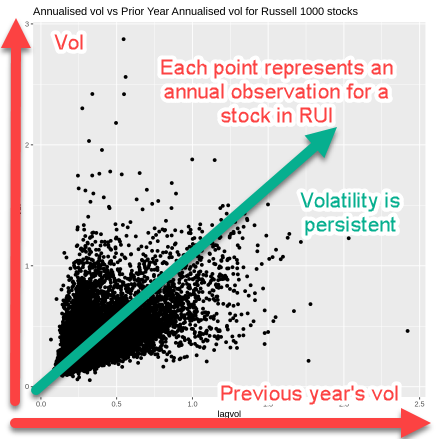
we create a scatterplot. a point for each stock for each year.
vol on the y-axis and its vol the previous year on x-axis.

there's a clear relationship. The assumption WAS reasonable
stocks with higher vol last year are more likely to have higher vol this year.
stocks with lower vol last year are more likely to have lower vol this year.
i put a green arrow on the chart, just in case you're confused.
...
here's an example of something less likely to be persistent - returns.
"i want to find a stock that goes up next year - so i'm going to look for stocks which went up this year?"
is that reasonable, or wishful thinking?
are returns persistent over that horizon?

same procedure... we calculate annual returns for each stock. then we scatterplot.
each point is an annual observation for one stock.
annual returns on the y-axis. annual returns the previous year on the x-axis.
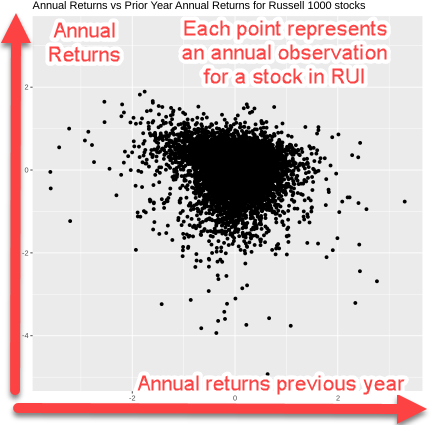
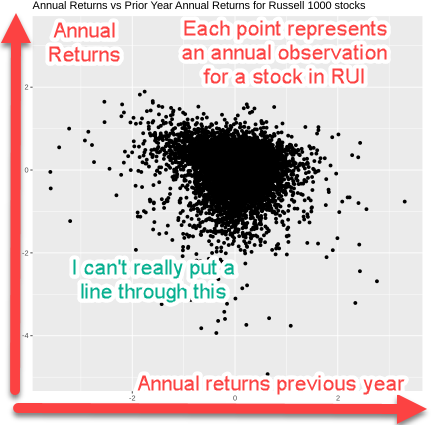
it's not such a reasonable assumption to be making.
most assets lack clear and obvious persistence of returns. (also referred to as "trend").
To make trend-following work will require some skill. you can't generally assume the stuff that went up will carry on going up.
...
here's another example of a very ambitious thing people sometimes try - persistence of certain time-series behaviour
"i want to trade mean-reversion on some stocks (explicitly in the underlying or implicitly via options)
"hurst exponent quantifies mean-reversion/memory (kinda)
"so I'm going to look for stocks with low Hurst exponent"
reasonable assumption or wishful thinking?

same procedure...
first "hurst Exponent Go brrrr" over daily log returns for each stock each year.
(btw - there's probably some sample size bias in that simple function - but all my samples are the same size everywhere, so it'll be similar everywhere)
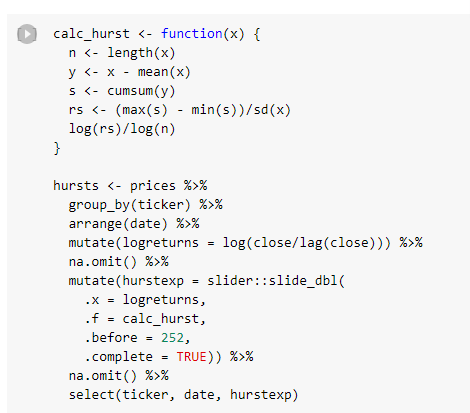
now scatterplot.
each point an observation for a stock for a year. (no overlaps)
hurst exponent on the y-axis. Hurst exponent last year on the x-axis.
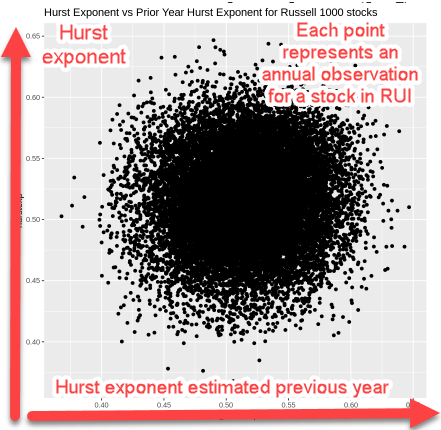
there's no real evidence of any kind of persistence here.
a stock with a low hurst exponent last year isn't more likely to have a low hurst exponent next year.
the assumption of persistence - at least generally and at this timescale - would be unreasonable.
screening for mean-reversion candidates on the basis of past estimations of hurst exponent alone probably isn't a good idea.
you knew that already, of course...
market prices are highly efficient and returns are dominated by noise.
would you expect moves to revert all the time? probably not right? at least when you've filtered for bid/ask bounce. you need to think about the causal mechanism. when would flows distort price significantly such that it tends to subsequently revert? these are the questions you want to obsess about, not time series stats stuff.
...
does this mean that "data-mining/screening for past time series characteristics" is worthless?
no - i do some of it (not often tho)
but it does mean you need to carefully identify the assumptions you are making and do your best to ensure they are reasonable.
remember our most useful tools as a trader are:
- economic intuition
- simple data analysis
never forget the first...
an understanding of the structural constraints / pressures that would cause the price behavior you are interested in is more valuable than trying to observe it directly in the past time-series.
of course, being able to do both is ideal... but we can't always get what we want.
the most important lesson:
Identify all the assumptions you're making and test whether they are reasonable.
don't bullshit yourself.
beep...boop